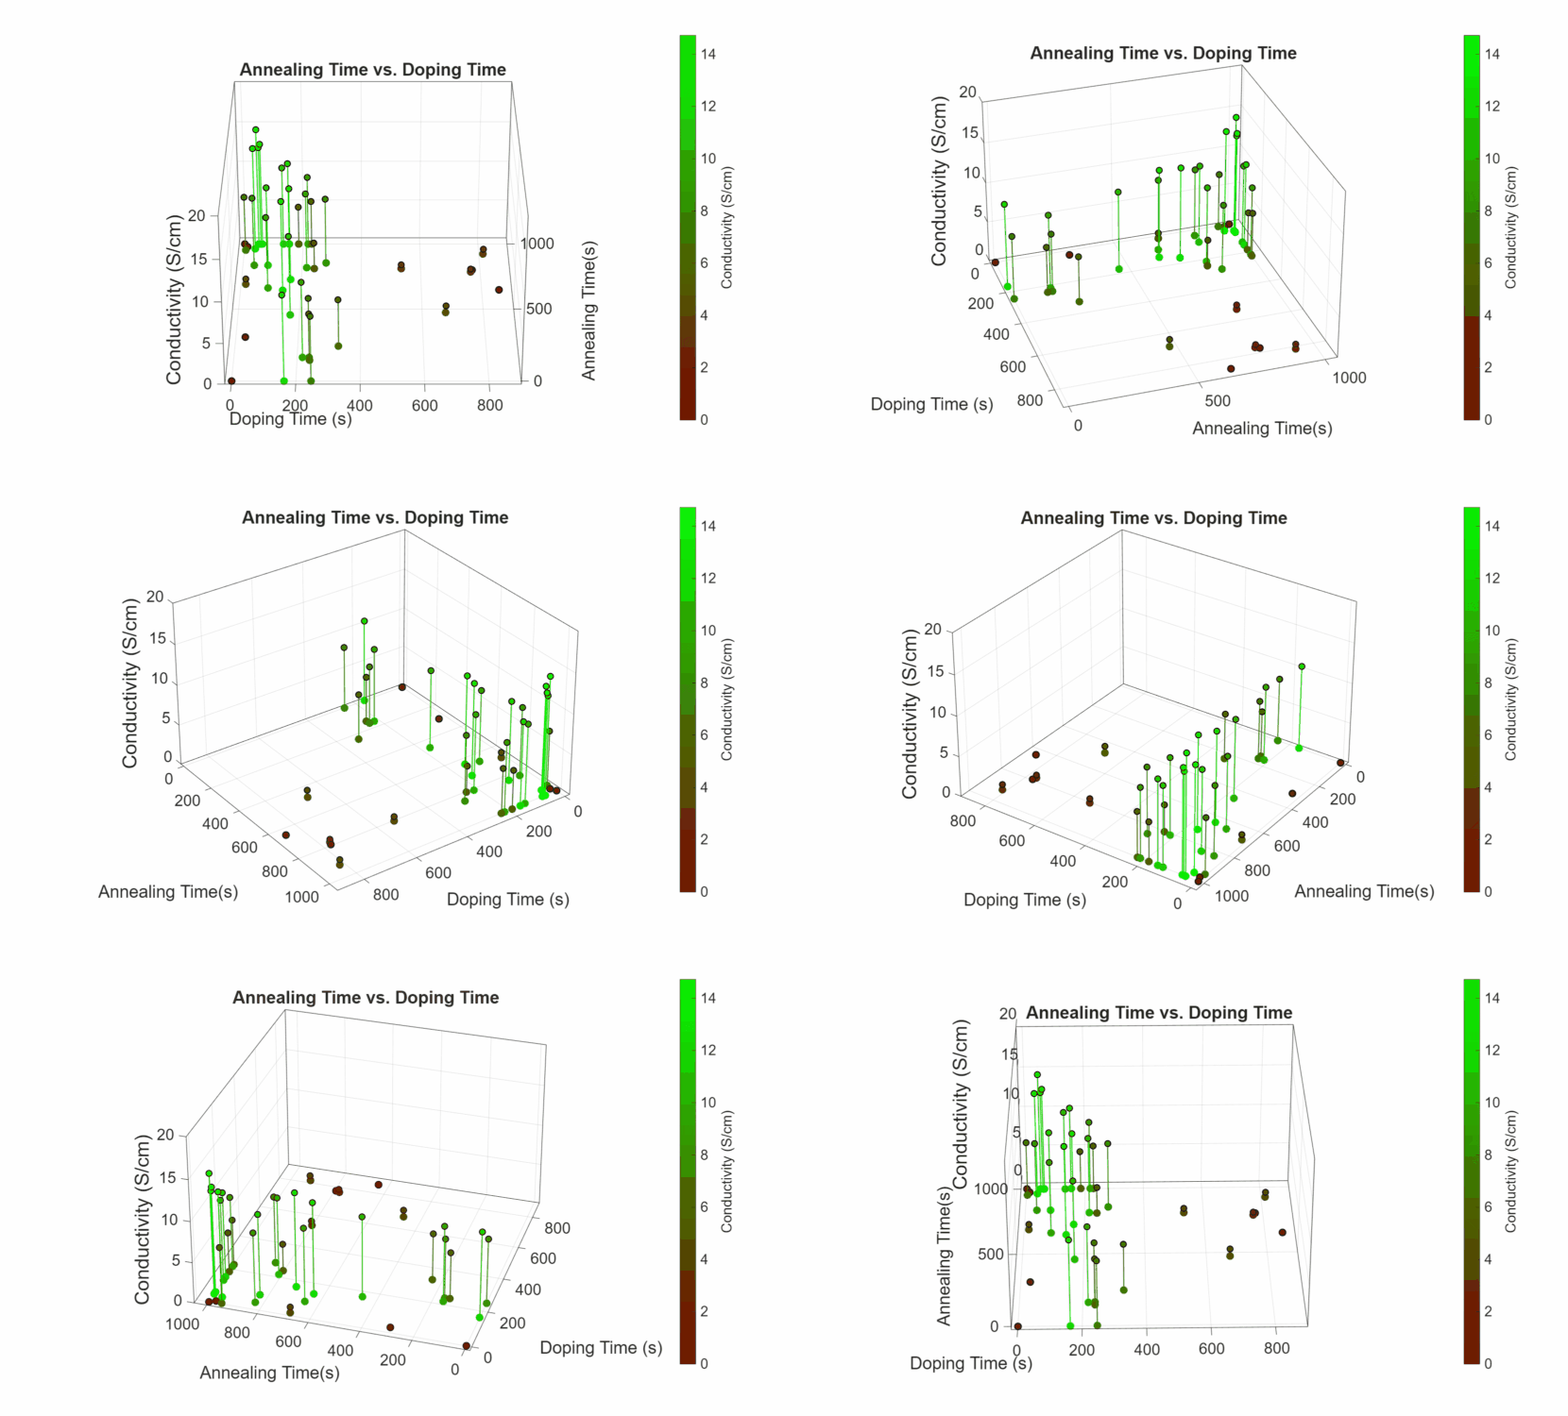
This is a three-dimensional (3D) graph of the conductivity (represented with the vertical), given the input parameters, doping time and annealing time. Each data point is plotted in 3D space, and is also drawn directly onto the bottom plane, with corresponding points represented by a vertical line between them. This graph shows a correlation of increased conductivity at higher annealing times, and at lower doping times that are not zero.

